

The short answer belongs on the table first
PMax, Feed-only PMax, and Standard Shopping do not have a universal winner. They solve different problems.
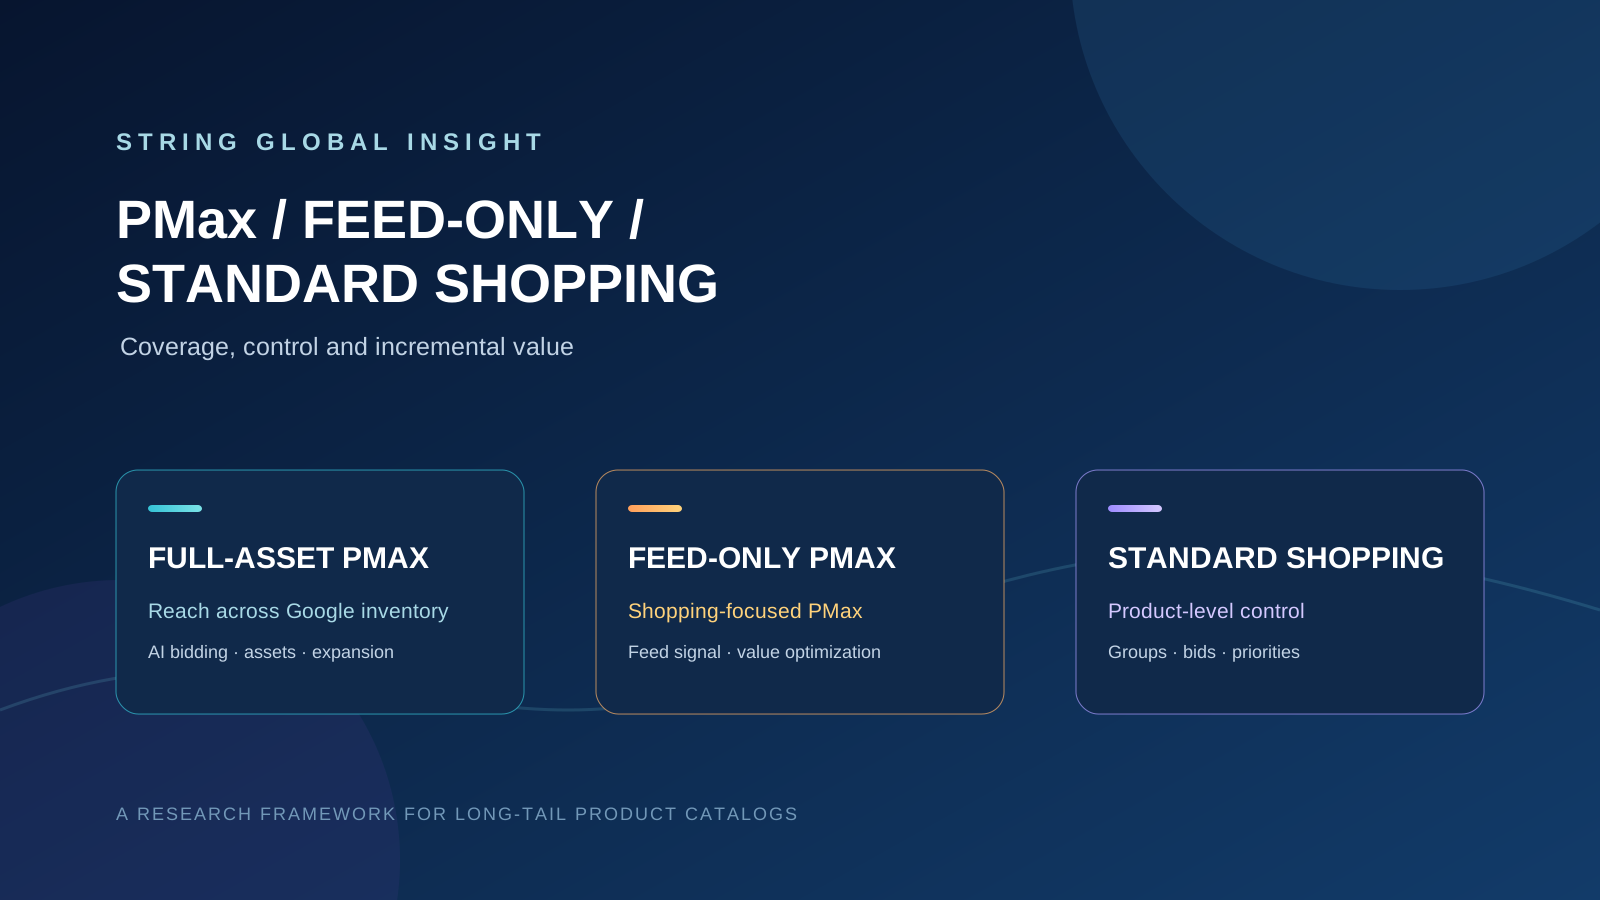
Full-asset PMax is built to mobilize more Google inventory under a conversion goal. Feed-only PMax keeps PMax’s automated bidding and value decisions while narrowing the operating focus toward product-feed traffic. Classic Standard Shopping gives advertisers more direct control over product pools, product groups, bids, and campaign priority.
For a DTC store with stable inventory, strong visual assets, and enough conversion volume, Full-asset PMax deserves a serious test. For industrial parts, MRO products, and surplus inventory, the first question is usually product coverage and demand capture. Putting every SKU into one PMax campaign and judging the account by total ROAS leaves too much unexplained. A cleaner approach is to separate the product pools, use Standard Shopping to test coverage, use Feed-only PMax to test value optimization, and move only products with evidence of incremental value into Full-asset PMax.
This does not turn Standard Shopping into a button that guarantees an impression whenever a part number matches. Standard Shopping is also subject to product eligibility, bids, budget, competition, Ad Rank, and seasonality.[5][19] Its practical advantage is a clearer control surface and a more interpretable test environment.
The bracketed numbers in this article correspond to the sources listed at the end. Google Ads features are released by market, account eligibility, and interface version. This article reflects the documentation available on August 18, 2026.
Why ROAS can pull the discussion in the wrong direction
This article began with a public help post about industrial surplus inventory. The seller carries electrical components, HVAC parts, MRO products, and automation equipment, with roughly 4,000 active SKUs. Inventory is usually one-off rather than replenished through a normal catalog cycle. Customers are often first-time buyers, and their searches may contain an exact model number or part number.
The author reported that about 600 products had received no impressions in 30 days, around 500 had received fewer than 10 impressions, about 2,000 had no clicks, and around 3,000 had two clicks or fewer. Against a 4,000-SKU catalog, those self-reported figures correspond to roughly 15% with zero impressions, 50% with zero clicks, and 75% with two clicks or fewer. The figures come from the public post and have not been independently verified through a Google Ads account export.[18]
The important part of this case is the separation between two goals that are often blended together.
- Giving an eligible SKU a chance to enter an auction when demand exists is a coverage question.
- Directing more budget toward orders, quotes, or profit is an efficiency question.
An account can produce excellent ROAS on a small group of popular products while a large long-tail catalog receives almost no exposure. A campaign-level report will not automatically reveal that both outcomes are happening at once.
Google’s documentation also does not promise equal exposure for every product in a feed. PMax is designed to use conversion goals, budget, and real-time signals to find auctions that it predicts are more likely to produce the desired outcome.[1] Google’s channel-report documentation says that a channel may receive little or no recent delivery because budget is being prioritized toward channels expected to produce a higher return at that moment.[6]
That logic is reasonable when the goal is total conversion value. It can conflict with a one-off inventory business that must be visible during the rare moment when someone searches for a specific part.
What the three approaches mean inside Google Ads
Full-asset PMax
PMax is a goal-based campaign type. Google says it can access Search, Shopping, YouTube, Display, Discover, Gmail, Maps, and other inventory from one campaign, while AI handles bidding, budget optimization, audiences, creatives, and attribution.[1]
Once a Merchant Center feed is attached, product data can support Shopping ads and other feed-powered formats. Adding text, images, and video gives the system more eligible combinations across Google inventory. Google’s retail guidance explicitly recommends adding a variety of creative assets to expand eligible serving opportunities.[2]
The advantage is reach and automation. The cost is that it becomes difficult to assign budget to every SKU or to tell from a campaign-level report whether a long-tail product lacked demand, lacked eligibility, or was ranked behind products with stronger predicted value.
Feed-only PMax
Feed-only PMax is not a wholly separate algorithmic product. It is better understood as a creation method and campaign configuration. Google’s help documentation describes the setup as Shopping-only, which means skipping text, image, and video assets during initial setup and using the Merchant Center feed.[1]
Two details matter here.
First, Feed-only keeps PMax’s core logic. It still uses conversion goals, budget, context signals, and predicted value to decide how to bid. Removing creative assets narrows the available formats. It does not turn the system into a queue that gives every product an equal turn.
Second, Google currently states that if assets are manually added after a Feed-only campaign is created, minimum asset requirements are enforced and the assets cannot later be removed to restore the Feed-only format.[1] Google also recommends adding creative assets to a Merchant Center campaign when the advertiser wants access to more eligible inventory.[1][2]
The accurate description is therefore Shopping-focused PMax, not an SKU coverage mode. Feed-only can isolate feed-driven value optimization. The absence of manually uploaded assets does not prove that long-tail products will receive more impressions.
Classic Standard Shopping
Standard Shopping is organized around product data and product groups. Google explains that advertisers manage inventory and bids through product groups rather than building ad groups around keywords. A product that is not included in an active product group or listing group is not eligible to serve.[3]
Product groups can be subdivided by Item ID, brand, Google product category, product type, condition, and custom labels. Each product group that is not subdivided can carry its own bid. This structure is useful when inventory, margin, category, and promotion priority need to be explicit.
Standard Shopping also supports automated and value-based bidding. Google says Shopping campaigns can use Maximize conversion value or Target ROAS, and conversion value can influence bids under Smart Bidding.[20] Standard Shopping should therefore not be treated as a completely manual CPC product from an earlier era.
The meaningful difference is the control boundary. The advertiser chooses which products enter a campaign, then defines how those products are grouped and bid. That makes it easier to hold the product pool constant in a coverage experiment.
The three approaches side by side
| Dimension | Full-asset PMax | Feed-only PMax | Classic Standard Shopping |
|---|---|---|---|
| Primary job | Maximize overall value across Google inventory | Apply PMax value optimization to a feed-focused product pool | Manage products, groups, bids, and Shopping traffic |
| Eligible inventory | Search, Shopping, YouTube, Display, Discover, Gmail, Maps, and more | Designed as Shopping-only, subject to the actual account settings and reports | Primarily Shopping inventory |
| Budget control | Mainly allocated by the system within the campaign | Mainly allocated by the system within the campaign | Can be divided by campaign, ad group, product group, and bid |
| Product coverage control | Listing groups and feed filters help define the pool, but do not promise even exposure | Listing groups and feed filters define the pool, while PMax still ranks value | Active product groups make the product boundary more visible |
| Creative inputs | Text, images, video, and possible automatically generated assets | Initial setup skips text, image, and video assets | Product data generates Shopping ads |
| Query visibility | Search terms, ad formats, negative keywords, and newer controls | Still governed by PMax search and value logic | Managed through product data, product groups, bids, and exclusions |
| Best measurement focus | Incremental conversions, cross-channel value, creative and channel mix | Feed traffic value and product-pool efficiency | SKU coverage, product-level bids, Shopping traffic, and profit |
| Main misconception | High total ROAS means the catalog is well covered | No uploaded assets means fair exposure | A matching part number guarantees an impression |
“Classic Standard Shopping” is used here to make a clean comparison with PMax. Google launched the AI Max for Shopping beta on Shopping campaigns in 2026. It adds text customization, Final URL expansion, and format selection, so it should be recorded as a separate test state rather than treated as the old static Shopping configuration.[10][11]
Why PMax can concentrate budget in a small product set
PMax optimizes for target outcomes, not for an even display distribution across a catalog. Product A may have more historical conversions, stable price competitiveness, and complete landing-page and stock signals. The system can estimate its conversion value in a given auction with more confidence. Product B may have one unit, no historical click, and few comparable signals even when its price is attractive.
This does not mean Google has a rule that products without history cannot serve. A long-tail product with no impressions can be affected by eligibility, feed freshness, the presence of a model number in the title or identifier fields, stock, bid competitiveness, overlap with another campaign, and changes in competition.[3][5][12]
smec’s public analysis of more than 4,000 PMax campaigns across more than 500 advertiser accounts found that feed-based ads typically accounted for 74% to 97% of PMax cost, with a median of about 90%.[15] That suggests a large share of Full-asset PMax spend may indeed occur in feed-driven ads. It does not show how evenly that spend is distributed across SKUs. A campaign can spend 90% of its budget on product ads and still concentrate that spend on a small group of products with the strongest predicted value.
A useful report must therefore separate two questions.
- Channel mix. How much spend used product-data formats, video, Display, or other inventory?
- Product coverage. How many eligible SKUs received an impression, click, or relevant query?
Google’s PMax channel report can split performance by channel and ad format and can surface missing assets, feed issues, or budget limitations.[6] It does not define how many impressions every SKU should receive. That is a business metric the advertiser must create.
Standard Shopping also does not mean “match equals show”
The intuition that Standard Shopping is “dumb but guaranteed to match” comes from its visible controls. The guarantee does not exist.
Google’s low-traffic troubleshooting list includes account and billing problems, feed review, out-of-stock products, product-group exclusions, low bids, budget constraints, campaign overlap, competition, conversion tracking, and seasonality.[5] Google also notes that a bid may be too low for a campaign to enter or win enough auctions even when a product is marked eligible.[5]
Ad Rank first determines whether an ad is eligible to show and then determines where it appears relative to other eligible ads. Bid, ad and landing-page quality, competition, search context, and other signals all matter.[19] The same auction reality applies to Standard Shopping and PMax.
The real value of Standard Shopping is explainability. An advertiser can answer questions such as these.
- Is the SKU included in an active product group?
- Which inventory, margin, or condition bucket contains it?
- What bid does it carry right now?
- Does the same item appear in multiple Standard Shopping campaigns?
- Has a higher-priority campaign reserved or exhausted its budget?
- Is the product approved, in stock, and consistent with its landing page in Merchant Center?
If those questions cannot be answered, changing campaign type only moves the uncertainty.
What the public data can and cannot support
There is plenty of public material about PMax and Standard Shopping. There are far fewer numbers that can support a clean horizontal comparison. The table below keeps the figures and their limits together.
| Source | Sample or measurement | Publishable figure | What it cannot prove |
|---|---|---|---|
| Google AI Max for Shopping Help | Google internal data, global retail advertisers, 2026 | Advertisers activating AI Max for Shopping typically see 5% more conversions or conversion value at a similar CPA or ROAS | It is not independent research and is not a PMax versus Classic Standard Shopping head-to-head result |
| smec State of PMax 2025 | More than 4,000 PMax campaigns and more than 500 advertiser accounts | Feed-based ads represented roughly 74% to 97% of PMax cost, with a median near 90%; smec recommends at least 30 monthly conversions and ideally 60 or more | This is one organization’s sample and analysis, not an industrial long-tail benchmark |
| Joybird, Go Fish, and Think with Google | Custom furniture, PMax tested against Smart Shopping | 40% higher ROAS, 95% revenue lift, and 52% more clicks | The control was Smart Shopping, not Standard Shopping, and the catalog and conversion density were different |
| Public industrial-surplus help post | Self-reported account with roughly 4,000 SKUs | 600 products with zero impressions, 2,000 with zero clicks, and 3,000 with two clicks or fewer | Account identity, feed status, bids, geography, and conversion settings were not independently verified |
Google labels the AI Max for Shopping +5% result as Google internal data, global, 2026, retail advertisers.[10] It can be quoted as a platform product claim. It should not be presented as an industry average.
The Joybird case is closer to a controlled migration test. Go Fish states that it held the products, audiences, bidding strategy, and daily budget constant while monitoring conversion volume, conversion rate, and cost per conversion.[17] That shows why test structure matters, and it shows that PMax can produce a strong result in a B2C furniture account. Google’s case page reports the same 95% revenue lift and 40% ROAS improvement.[16] It does not answer the long-tail coverage question for industrial surplus.
smec’s data adds another warning. Platform metrics can look strong, so advertisers should compare them with back-end revenue, profit, acquisition cost, and average order value.[15] Industrial advertisers should add quotes, phone calls, emails, and delayed closed-won outcomes.
As of this research date, I did not find a public benchmark that simultaneously provides industry segmentation, open sampling, consistent definitions, and a fair PMax versus Standard Shopping comparison. A claim such as “industrial PMax averages this ROAS” needs real account data. Without it, the number is decoration.
How to test different industries and product types
Industrial parts and surplus inventory
The key event may be an engineer, maintenance worker, or buyer searching for a part number at a specific moment. Demand can be infrequent, the order can be large, and the item may disappear after one sale.
The test should measure query coverage and qualified commercial outcomes. Clicks alone are weak evidence when one phone call can sell dozens of units or one quote may become an order days later.
Stratify low-history SKUs by category, price, margin, stock quantity, brand, and feed completeness. Then assign them to Standard Shopping and Feed-only PMax while excluding every test item from other campaigns. Check titles, brand, MPN, condition, availability, and landing pages first. Merchant Center product data is what Google uses to match products to queries, and missing or conflicting information can limit eligibility or serving.[12]
High-value B2B products
Industrial equipment, custom parts, and large HVAC products may produce few online checkouts but many inquiries, calls, and quotes.
Online checkout should not be the only conversion. Google supports importing offline outcomes that begin with an ad click or call and later become a sale, including enhanced conversions for leads that use hashed user-provided data for matching.[14]
Record qualified inquiry, accepted quote, and closed order as separate stages with separate values and delays. Compare qualified revenue and margin, not just form submissions.
Visual products with stable inventory
Furniture, apparel, beauty, and home goods often have richer images, videos, and audience signals, with replenishable inventory. Shoppers may browse, compare, and return before buying.
Full-asset PMax has a stronger case for testing here. The Joybird public case involved this type of setting, and its controlled comparison against Smart Shopping reported higher ROAS, revenue, and clicks.[16][17]
Standard Shopping still works as a control or product-level validation layer. A high ROAS result may be explained by brand searches, returning users, or best sellers, so the test should also examine new customers, total revenue, and incrementality.
Seasonal and promotional products
Seasonal campaigns need product pools and budgets to concentrate on specific dates. Standard Shopping campaign priority can make a higher-priority Shopping campaign provide the bid when the same product exists in multiple Shopping campaigns. When the higher-priority campaign runs out of budget, a lower-priority campaign may take over.[4]
That is a budget-routing tool, not an impression guarantee. Remove product groups, feed labels, and budgets when the promotion ends, or the old campaign can keep affecting delivery.
Low-margin, clearance, and volatile-price products
The objective is often contribution margin rather than revenue. Pass accurate price, stock, and cost-related information through the feed, then use custom labels to separate margin, inventory risk, and clearance state. Google allows up to five custom-label attributes for reporting and bidding in PMax, Shopping, and Demand Gen.[13]
When high-margin scarce items and low-margin abundant inventory share a campaign, value-based optimization may not follow the merchant’s inventory policy. Separate product pools are easier to explain than repeated target-ROAS changes in one mixed campaign.
The primary metrics should be broader than ROAS
Product coverage
The denominator should be the number of active, approved, in-stock SKUs that are included in the campaign for the target country and date range. Paused, disapproved, excluded, and out-of-stock items do not belong in the denominator.
Four useful metrics are these.
- SKU impression coverage. Eligible SKUs with at least one impression divided by all eligible SKUs.
- Zero-impression rate. The share of eligible SKUs with no impression.
- SKU click coverage. The share of eligible SKUs with at least one click.
- Query coverage. The share of a prebuilt model-number or part-number query set that received an impression.
Google warns that product-level impression counts in the Product Groups view can differ from campaign-level impressions. If several products appear in one Shopping slot, each product can receive a product-level impression while the campaign counts one ad impression.[3] The coverage metric must therefore use one fixed report layer and one fixed denominator.
Demand capture
Query coverage, Search impression share, impressions lost to budget, impressions lost to rank, model-number click-through rate, and landing-page availability are closer to the industrial problem than total clicks alone.
PMax now exposes search terms, landing pages, and ad formats, including a distinction between Shopping ads and Text ads.[7] That gives advertisers a better way to check whether PMax is actually spending on product searches. Placement reports are incomplete across the campaign and should be used for brand safety rather than total performance evaluation.[6][21]
Commercial outcomes
Aggregate results in this order.
- Online purchase revenue.
- Qualified calls and qualified quotes.
- Imported closed-won orders and contribution margin.
- Profit contribution by eligible SKU.
- New-customer share and qualified acquisition cost.
For one-off inventory, also record sell-through and the time until stockout. A product that sells once is not automatically an advertising failure. It may have completed its job. A product with many clicks and no qualified quote may have a feed or landing-page problem.
Proposed test-report IDs and experiment designs
The IDs below are internal templates designed for future account tests. They are proposed test designs, not completed String Global or client experiments, and the tables do not contain historical results. Before publishing actual results, replace the placeholders with Google Ads exports, Merchant Center diagnostics, CRM records, and order-system data.
The naming scheme is SG-PMX-year-project-branch-version. SG-PMX identifies the String Global PMax research series, the two-digit year identifies the planning year, the three-digit project number identifies the research theme, the letter identifies the test branch, and the version records design changes.
| Report ID | Scenario | Comparison | Primary metrics | Status |
|---|---|---|---|---|
| SG-PMX-26-001-A-v1.0 | Industrial long-tail, 600 low-history SKUs | Feed-only PMax versus Classic Standard Shopping | Zero-impression rate and SKU impression coverage | Proposed design |
| SG-PMX-26-001-B-v1.0 | Industrial winners, 300 SKUs with order history | Feed-only PMax versus Full-asset PMax | Contribution margin, incremental orders, channel mix | Proposed design |
| SG-PMX-26-001-C-v1.0 | Calls, quotes, and offline orders | Online and offline measurement across all three campaign types | Qualified revenue, gross profit, conversion lag | Proposed design |
| SG-PMX-26-002-A-v1.0 | B2C visual products | Full-asset PMax versus Standard Shopping | Incremental revenue, new-customer cost, ROAS | Proposed design |
| SG-PMX-26-002-B-v1.0 | Seasonal promotion | Standard priority structure versus PMax asset group | Promotional profit, budget use, sell-through | Proposed design |
| SG-PMX-26-003-A-v1.0 | AI Max for Shopping beta | FUE off versus FUE on | Incremental queries, product revenue, landing-page quality | Proposed design |
SG-PMX-26-001-A-v1.0
This is the test closest to the industrial long-tail question. Select 600 SKUs with few impressions and clicks in the previous 30 days but eligible status in Merchant Center. Stratify by industry, price, margin, stock, brand, and historical clicks, then randomize into two groups. Keep country, language, dates, conversion window, and budget limits consistent.
The Standard Shopping group uses explicit product groups and bid rules. The Feed-only PMax group targets the same products and uses the same conversion goals. Exclude both pools from every other campaign. Google’s official Standard Shopping versus PMax experiment documentation also requires the same products and no outside campaign targeting those products.[8][9]
Google recommends running experiments for at least four to six weeks, while its PMax feed guidance says to run the campaign for at least six weeks.[2][9] Industrial sales also have quote and order delays, so a six-week observation window should be followed by a complete sales cycle.
The test asks whether coverage and value improve together. Observe these three outcomes.
- Does the Standard Shopping group reduce its zero-impression rate?
- Does query coverage increase, especially for prelisted model and part-number searches?
- Does qualified revenue and contribution margin stay above the control line?
A proposed decision rule is to move a configuration forward only if coverage improves materially while contribution margin declines by no more than a pre-agreed 10% relative to control. The 10% is a pretest internal guardrail, not an industry standard. A real account should set it according to margin and cash-flow tolerance.
SG-PMX-26-001-B-v1.0
This test asks whether creative assets create additional value for industrial products that already have proven demand. Select 300 SKUs with stable clicks or orders, complete feed data, usable images, and functioning landing pages. Give Feed-only PMax and Full-asset PMax non-overlapping product pools, or use Google’s experiment tooling for traffic allocation.
Save the PMax channel performance report every day and separate Ads using product data, Search, YouTube, Display, and other available channels.[6] If attributed conversions increase in the Full-asset group but total orders, qualified new customers, and contribution margin do not, the extra channel reach should not be called incremental.
SG-PMX-26-001-C-v1.0
Industrial transactions often finish by phone or email. Before the test, create a shared identifier for calls, forms, quotes, and orders. Preserve GCLID or compliant first-party matching data, and record qualified lead, accepted quote, and closed order as separate conversion actions.
Google’s offline-conversion documentation explains how an ad click or call can later be connected to an offline sale, while enhanced conversions for leads can supplement the match with hashed user-provided data.[14] The implementation adds work, but it prevents the campaign from learning toward online checkout when the business is actually judged by closed sales.
Record conversion lag explicitly. A campaign can generate many calls in seven days and produce the related orders thirty days later. Treating immature calls as worthless will make a long sales cycle look like poor traffic.
SG-PMX-26-002-A-v1.0
Use this test for apparel, furniture, beauty, and other products with replenishable stock and rich visual assets. Segment by price, brand, historical conversion, and new-versus-returning customer mix. Keep the product range, budget, conversion goal, and observation period as similar as possible between Full-asset PMax and Standard Shopping.
Public cases can supply hypotheses, not fill in results. In the Joybird case, PMax was tested against Smart Shopping and produced a 40% ROAS improvement, a 95% revenue lift, and a 52% increase in clicks.[16][17] A new account must verify the result independently, especially whether brand search, returning users, and promotions explain most of the lift.
SG-PMX-26-002-B-v1.0
This test examines budget routing. Put promotional products in a high-priority Standard Shopping campaign, routine products in a low-priority or separate campaign, and compare that structure with a PMax holiday asset group. Record campaign priority, budget constraints, product overlap, and the promotion end date.
Google says campaign priority determines which Shopping campaign’s bid participates when multiple Shopping campaigns share a product, with a lower-priority campaign taking over when the higher-priority campaign runs out of budget.[4] It does not control PMax’s choice for the same product across campaigns, so the PMax product pool must be excluded or separately assigned in the test design.
SG-PMX-26-003-A-v1.0
AI Max for Shopping beta needs its own test. Classic Standard Shopping, AI Max with FUE off, and AI Max with FUE on are three different states and should not be combined into one Standard Shopping bucket.
Google says AI Max for Shopping can generate feed-grounded titles for complex searches, use Final URL expansion to choose other commercial pages, and select between text and Shopping formats.[10][11] If an industrial site has inconsistent category, knowledge, and product pages, FUE may change the landing-page distribution. Review the landing-page report together with quote quality.
A practical structure for a 4,000-SKU industrial account
Audit the feed and measurement before rebuilding campaigns
The product feed is a shared dependency for all three approaches. Merchant Center’s product specification says Google uses submitted product data to match products to queries, and that incorrect, missing, or conflicting information can cause disapprovals, limited eligibility, incorrect displays, or no serving.[12]
At minimum, check these fields for industrial products.
iduses a stable SKU and does not change unnecessarily during updates.titlecontains brand, MPN, product type, key specifications, and condition rather than hiding the model number at the end of the description.brandandmpnmatch the packaging, nameplate, or verifiable source where possible.conditionaccurately distinguishes new, used, refurbished, and other supported states.availabilitymatches the landing-page stock status.price, shipping, delivery time, and purchase status match the page.- Variants, images, structured data, and landing-page URLs agree with the feed.
Google permits five custom-label attributes, with up to 1,000 unique values for each attribute.[13] A surplus-inventory account could use definitions like these.
| Field | Suggested meaning | Example values |
|---|---|---|
| custom_label_0 | Industry | MRO, Electrical, HVAC, Automation |
| custom_label_1 | Stock quantity | 1, 2-5, 6-25, 26+ |
| custom_label_2 | Margin tier | Low, Mid, High |
| custom_label_3 | Condition | New, Used, Surplus, Refurbished |
| custom_label_4 | Test queue | Long-tail, Winner, Full-asset-test, Holdout |
The last label is a queue field rather than a permanent product fact. Update it as the experiment and inventory state change.
Then create non-overlapping product pools
Using a $350 daily budget, this article offers a starting test allocation rather than a universal recommendation.
- Standard Shopping coverage pool, about $175 per day.
- Feed-only PMax winner pool, about $105 per day.
- Full-asset PMax incremental test pool, about $70 per day.
These amounts simply separate the test jobs. Adjust them after checking eligibility, historical conversions, margin, and sales-cycle length. The important rule is that each SKU has a traceable owner. A catch-all campaign must not silently pull test products back into the auction.
A readable structure could look like this.
SS-Coverage-LongTailhandles low-history and long-tail products, split by industry, condition, stock, and margin.PMX-Feed-Winnersreceives products with sufficient history and stable feed quality.PMX-FullAsset-Incrementalreceives a separate test pool with separately recorded creative and channel results.SS-Holdoutor an unadvertised queue keeps a small eligible set for natural-demand and feed diagnostics.- Build a separate Search campaign when model-number text ads are needed, rather than combining Search, Shopping, and PMax outcomes into one number.
A catch-all is not a low-bid guarantee. If a product is outside an active product group, has incomplete feed data, or cannot enter the auction at its bid, a low-bid catch-all only hides the problem. It is more useful as an unassigned-product alert and funnel check.
How to investigate the Feed-only decline after June 2025
The public Google documentation confirms that PMax gained channel reporting, search-term reporting, campaign-level negative-keyword lists, and additional controls after 2025.[6][7] I did not find official evidence that every Feed-only PMax campaign experienced one universal algorithm failure in June 2025. An account-level timeline still has to be checked first.
Put the timeline together
Place conversions, spend, feed updates, stock changes, price changes, site migrations, bid strategies, budgets, and account change history on one timeline. Do not compare only two calendar-month ROAS figures.
Separate channels and ad formats
The PMax channel report supports date selection from June 6, 2025 onward and can separate channels and formats such as Ads using product data.[6] Compare Shopping, Search, YouTube, Display, and other available formats before and after the decline.
If YouTube spend increased, do not label it waste immediately. Check whether it generated qualified visits, calls, quotes, or orders later, and whether budget constraints reduced lower-funnel product delivery. Last-click performance from one channel cannot establish cross-channel incrementality.
Check feed and product eligibility
Review Merchant Center diagnostics for zero-impression SKUs, feed timestamps, price and availability consistency, brand and MPN, landing-page status, product-group paths, and campaign exclusions. Google’s low-traffic guide lists out-of-stock products, expired feeds, unlinked Merchant Center accounts, budget, low bids, and conversion tracking among common causes.[5]
Check conversion goals and values
If online checkout fell while phone and email orders continued, the issue may be measurement or a change in the checkout path. Smart Bidding in both PMax and Standard Shopping responds to conversion goals and value definitions. Google recommends transaction-specific values for Maximize conversion value and suggests waiting four weeks or three conversion cycles after changing value reporting before judging the result.[20]
Check price and competition
Industrial buyers compare stock, condition, delivery time, and total cost for the same model. More eBay sales or more competitor sales do not by themselves prove that Google stopped showing the product. Combine Auction insights, Merchant Center price information, landing-page stock, call recordings, and sales notes.
A decision on the four original options
A. Continue Full-asset PMax until learning finishes
This can be a controlled test. It is a weak plan for handing the entire 4,000-SKU catalog to one campaign and waiting for coverage to appear. Google does recommend a stable run period, and its feed guidance says to run PMax for at least six weeks.[2] Time does not replace product-pool separation, correct conversion goals, or channel reporting.
B. Move everything to Standard Shopping
A full migration is also too broad. Standard Shopping clarifies product and bid boundaries, but it remains subject to eligibility, competition, budget, and Ad Rank.[5][19] It is a strong candidate for a long-tail coverage test, after which actual data should determine what gets scaled.
C. Return to Feed-only PMax and diagnose the old winner
This is worth doing. Feed-only still provides a way to isolate feed-driven traffic, but the diagnosis should use today’s reporting capabilities. Export product eligibility, channel mix, search terms, conversion goals, and back-end orders before and after June 2025. That is how an account can separate algorithm change from inventory, measurement, or market change.
D. Use PMax for winners and Standard Shopping for long tail
For the industrial case described here, this is the most useful structure to test first. Each product pool gets one job.
- Standard Shopping answers whether long-tail products receive an opportunity to enter relevant auctions.
- Feed-only PMax answers whether products with value signals can generate orders more efficiently.
- Full-asset PMax answers whether additional channels and creative assets add incremental value.
Do not let all three target the same products and then use campaign reports to argue about the winner. Define the product pools first.
Closing view
The PMax question is not simply whether automation is good. The Standard Shopping question is not simply whether manual control is good. The decision depends on which logic the advertiser wants to give the budget to and whether first-party data can test that logic.
For industrial surplus inventory, the most valuable asset is not a strong-looking Ad Strength card or a high account-level ROAS. The business needs to know which SKUs are eligible, which model-number searches appeared, and whether clicks eventually produced calls, quotes, and real margin. Once those events are connected, the comparison becomes a reviewable operating decision rather than a debate based on habit.
If the account’s first goal is to have a chance to appear when someone searches for a model, test coverage first. Once coverage improves, test whether PMax can produce more value from that product pool. Separating those questions usually fits the business better than asking one campaign to solve everything.
Frequently asked questions
Can Standard Shopping guarantee an impression for an exact part number?
No. The product must be eligible, included in an active product group, competitive in the auction, and supported by enough budget. Ad Rank still applies. Standard Shopping makes the product boundary easier to inspect, but it does not guarantee delivery.[3][5][19]
Is Feed-only PMax completely limited to Shopping?
Google’s official creation method calls it Shopping-only and requires text, image, and video assets to be skipped at initial setup.[1] Automatic assets, Final URL expansion, AI Max settings, and interface changes still need to be checked in the actual account. Use the channel performance report to verify the formats that served instead of trusting the campaign name.[6]
Can all three campaign types run at the same time?
Yes, provided product overlap is explicit. For a formal comparison, exclude test products from other campaigns. Google’s PMax versus Standard Shopping experiment guidance makes the same requirement about identical products and external exclusions.[8][9]
How many conversions does PMax need?
Google’s official guidance emphasizes stable duration, conversion goals, and data quality rather than one universal threshold. smec’s public analysis associates at least 30 monthly conversions, ideally 60 or more, with lower volatility and better target-ROAS adherence in its sample. That is an observation from its dataset, not a Google hard rule.[2][15]
What if most industrial sales happen by phone and email?
Record calls, quotes, and closed orders as separate stages, then return qualified offline outcomes through offline conversion import or enhanced conversions for leads. Otherwise the campaign may learn toward form submissions rather than actual sales.[14]
Does AI Max for Shopping still count as Standard Shopping?
It remains built on a Shopping campaign, but the beta adds text customization, Final URL expansion, and format selection. Classic Standard Shopping, AI Max with FUE off, and AI Max with FUE on should be recorded as separate test states.[10][11]