

The first question most founders ask an ads team is: how much does Google Ads cost per month? There is no number to quote back. Two companies in the same category can run very different accounts: steady inquiries on a few thousand dollars a month for one, tens of thousands spent with nothing to show for it for another. The gap is rarely the size of the budget; it is almost always how the budget was calculated.
"How much does Google Ads cost" has no single-number answer, but it can be calculated. This guide walks through the four steps in order: breaking the bill down, reading public price references, back-calculating a budget, and checking what an agency's fees actually buy.
The Three Parts of a Google Ads Bill
Quotes are hard to compare because several different kinds of money get folded into one number. Unfolded, there are three.
Ad spend is the money paid to Google. Per Google's own definition, there is no minimum spend commitment, and the budget is set and controlled by the advertiser. Search ads are charged per click, and the amount actually charged is usually below the maximum bid you set.
Service fees are paid to the account-opening channel or agency: setup fees, top-up fees, monthly management fees, a percentage of spend, performance commissions. None of it is Google's pricing; it is the provider's own.
Hidden costs are the ones most often left out: landing pages and site changes, conversion tracking wired into the CRM, creative production, localization, and the sales team's time on follow-up. None of it shows up on a quote, but skip it and most of the earlier spending goes to waste.
Ad spend decides how much traffic you buy; the other two decide whether that traffic turns into inquiries and orders. Budgeting only for the first category is how many accounts start losing money.

Does Google Itself Charge a Setup Fee?
No. Google's documentation has no such line item, and its own definition of Google Ads is blunt: no minimum spend commitment, the budget is yours to set.
So where do the "setup fees", "opening deposits" and "minimum top-ups" come from? Commercial arrangements of the opening channel or the agency. Charging for them is not automatically unreasonable — handling your business documents, payment methods and advertiser verification does take real work. But before signing, insist a few things are put in writing: which portion is a service fee, which portion actually lands in your ad account, whether unused balance is refundable, and whose name the account ends up under. For settings that get locked in at signup, time zone and currency, it pays to plan them through the account setup and structure guide before registering.
Can Your Budget Overspend?
It can go over the daily budget, but not without limit. Under Google's budget rules, most campaigns may spend up to twice the daily budget on any given day; total monthly spend, however, never exceeds daily budget × 30.4 (the average number of days in a month) — so your monthly budget is not exceeded. Set a $100 daily budget and one day might spend $200, but the month caps around $3,040.
Public CPC Benchmarks: What the 2026 Data Says — and Doesn't
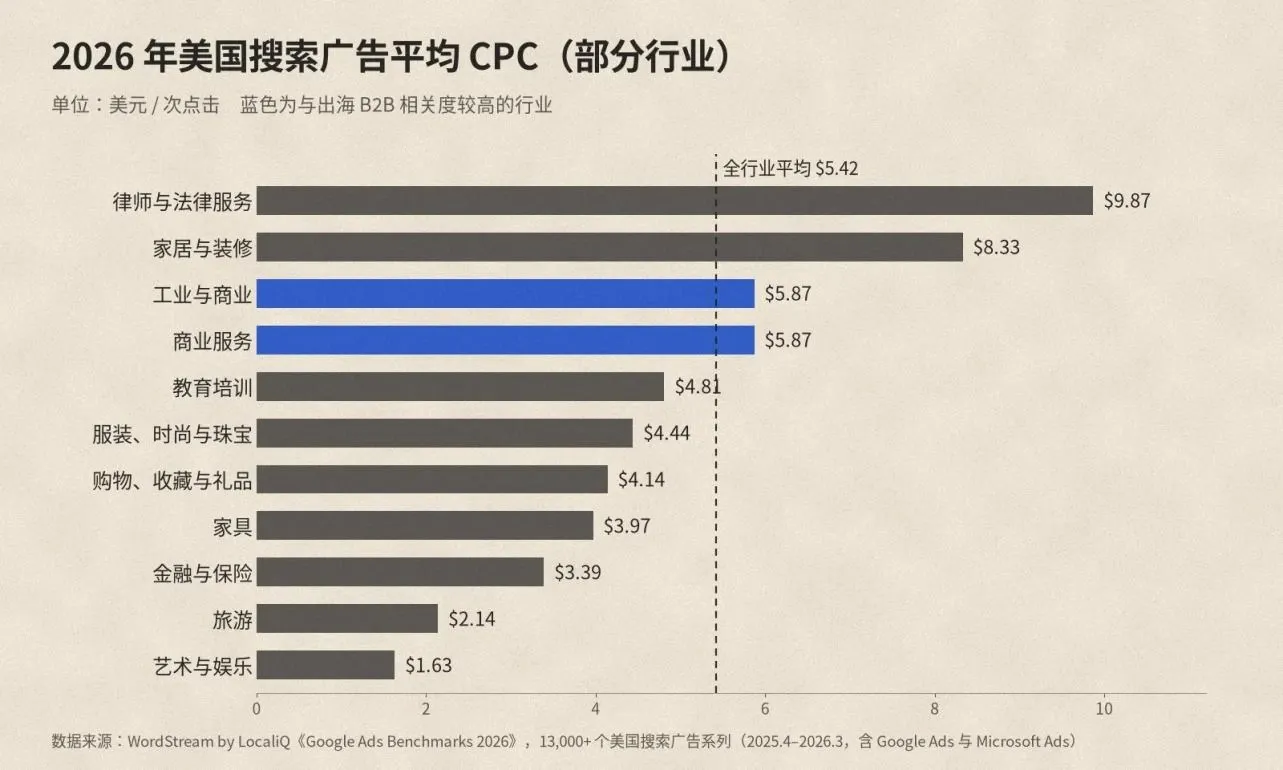
The click price is the starting point for every calculation. The most widely cited public dataset — updated yearly, broken out by industry — is WordStream by LocaliQ's search advertising benchmark report.
In the 2026 edition, the authors analyzed 13,000+ US search campaigns run between April 2025 and March 2026 across 23 industries, covering both Google Ads and Microsoft Ads: an industry-wide average CTR of 6.64%, average CPC of $5.42, average conversion rate of 8.18%, and average cost per lead (CPL) of $66.69. The previous edition showed an average CPC of $5.26 and CPL of $70.11 — clicks got a little more expensive while leads got cheaper, which the report calls the first CPL decline in five years.
A selection of industries closer to export businesses, again from the same report:
| Industry (report category) | Avg CPC | Avg CVR | Avg CPL |
|---|---|---|---|
| Industrial & Commercial | $5.87 | 8.20% | $75.19 |
| Business Services | $5.87 | 4.85% | $93.69 |
| Home & Home Improvement | $8.33 | 8.05% | $90.92 |
| Furniture | $3.97 | 2.99% | $106.70 |
| Apparel / Fashion & Jewelry | $4.44 | 4.50% | $97.51 |
| Shopping, Collectibles & Gifts | $4.14 | 4.01% | $49.40 |
| Education & Instruction | $4.81 | 13.14% | $77.48 |
| Finance & Insurance | $3.39 | 2.64% | $74.44 |
| Travel | $2.14 | 5.83% | $44.70 |
| Attorneys & Legal Services | $9.87 | 5.55% | $131.63 |
| Arts & Entertainment | $1.63 | 5.91% | $26.84 |
How to Read These Numbers
For gauging magnitude, they are fine. B2B advertising in the US runs several dollars a click, not a few cents; legal is visibly more expensive, travel and entertainment much cheaper. Knowing the scale keeps quotes from being misleading.
But do not set budgets straight off them. The sample is the US market, mostly LocaliQ's own customers — SMBs and local businesses — nothing like a Chinese B2B exporter's or cross-border ecommerce account. The word "conversion" is also loose: form fills, purchases and app installs all count. B2B cares about qualified inquiries, which are far rarer than form submissions; carry the 8% conversion rate into your plan and expectations will overshoot badly.
Two more caveats. Averages flatten keyword differences — within one industry, brand terms, model-number terms and broad category terms routinely differ by multiples. And the report covers search ads only; Shopping, PMax, video and App campaigns price and bill differently.
For prices close to your own business, use Google's Keyword Planner: set country, language and network, and it returns "top of page bid" low and high ranges — bid references, not guaranteed costs. And remember that high search volume does not make a market worth entering; that judgment comes before the budget, covered in High Search Volume Does Not Mean a Market Is Worth Entering.
The Core Method: Work Backwards from Target Inquiry Cost
The starting point should not be "how much do we feel like spending this year", but "what is one customer worth at most". The formulas below fit most lead-gen and ecommerce accounts.
Three Formulas
- Acceptable acquisition cost = gross profit per customer × the share of it you will spend on acquisition
- Acceptable platform CPA = acceptable acquisition cost × close rate (inquiry to deal) × qualified-inquiry share
- Monthly budget = monthly target conversions × acceptable platform CPA
Then run one feasibility check:
Estimated platform CPA = estimated CPC ÷ landing page conversion rate
If the estimated CPA comes out clearly above the acceptable CPA, the plan does not work at current prices, conversion rates and margins. Raising the budget will not fix it; one of the variables has to move first.
B2B Example: Industrial Equipment, Targeting the US
The numbers are illustrative, here only to show the math.
Assume an average first-order gross profit of $8,000 and a willingness to spend 25% of it on acquisition — one closed customer is worth up to $2,000. If about 10% of qualified inquiries close, one qualified inquiry is worth $200. Half of form fills are qualified, so the platform form CPA ceiling is $100. Want 15 qualified inquiries a month — that takes about 30 forms, so monthly budget = 30 × $100 = $3,000, or roughly $98.7 a day.
Now the feasibility check. The WordStream 2026 benchmark puts Industrial & Commercial average CPC at $5.87. Assume a 4% landing-page form conversion rate (illustrative), and estimated form CPA = 5.87 ÷ 4% ≈ $147 — nearly half again above the $100 the math allows.
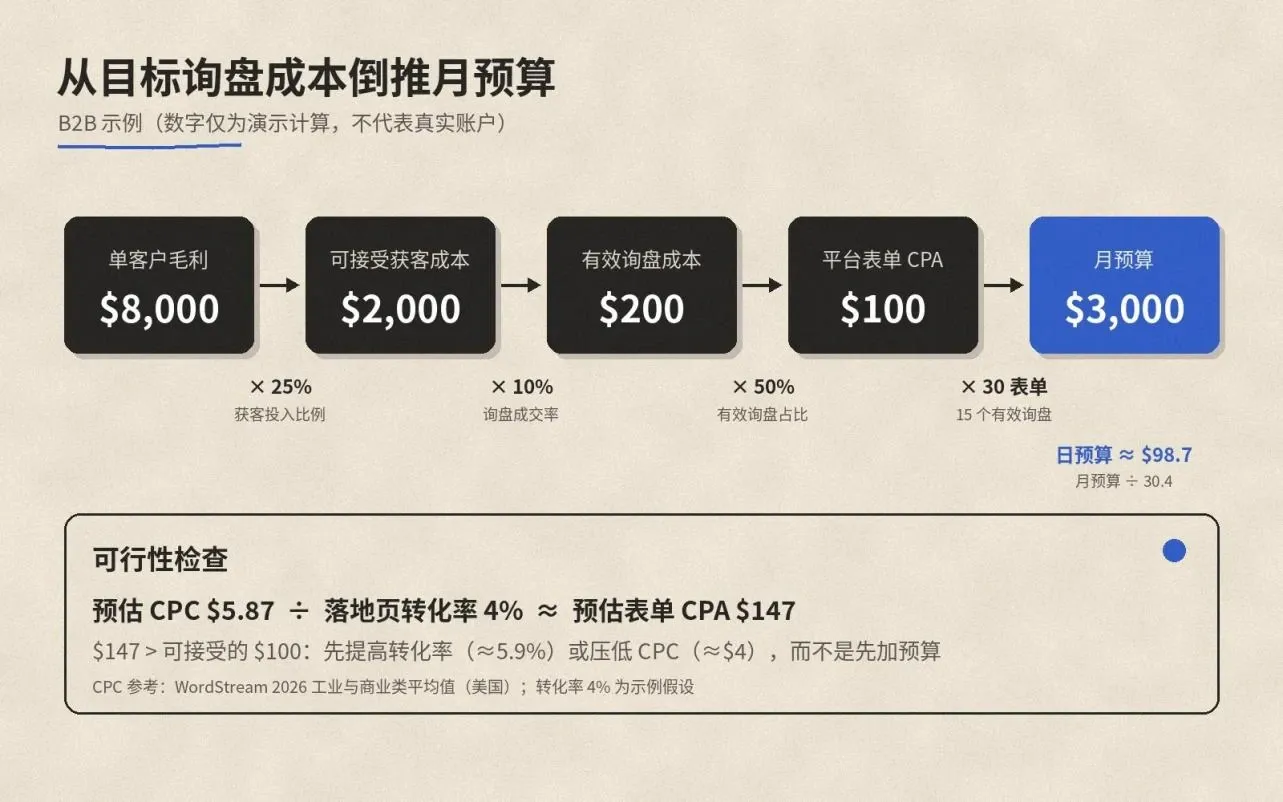
Three levers can move now: lift landing-page conversion to about 5.9%; push average CPC down to around $4 using sharper model-number terms, stronger ad relevance and negative keywords (the full workflow is in the keyword-to-page guide); or recompute what a customer is worth, bringing repeat purchases and long-term relationships into the ceiling. Change nothing and just double the budget from $3,000 to $6,000, and most likely you get twice the inquiries at the same or worse cost each.
The conversion lever usually comes down to making keywords, ad copy and landing page speak to the same purchasing need instead of talking past each other.
Ecommerce Example: DTC Apparel, Targeting the US and Europe
Illustrative numbers again.
A $90 average order, minus product, shipping and payment costs, leaves a 40% margin — $36 per order. That $36 is the break-even CPA, or a break-even ROAS of 90 ÷ 36 = 2.5. Want $12 of profit per order, and the target CPA becomes $24 (target ROAS 90 ÷ 24 = 3.75). At a 2.5% site conversion rate, the affordable average CPC is just 24 × 2.5% = $0.60.
The WordStream 2026 benchmark puts Apparel search CPC at $4.44. If Keyword Planner shows your target terms in that range, a $90 AOV on broad category search terms is hard to run profitably. Options: bundles and free-shipping thresholds to raise AOV; work on conversion rate; or carve out part of the budget for feed-driven Shopping as a separate test — PMax and standard Shopping solve different problems, so decide first whether you are validating reach or efficiency.
For repeat-purchase categories, first-order plus repeat gross profit can set the acquisition ceiling — provided real repeat data exists, not a guess.
Why CPC Varies So Much: Five Main Variables
The same keyword can cost very different amounts across accounts. Per Google's explanation of actual CPC, you only pay enough to clear the ranking threshold and to beat the advertiser directly below you. Under that rule, five things drive CPC.
Industry and Keyword Intent
Industries closer to purchase, with more valuable customers, see bolder bids. In the table above, legal averages $9.87 a click in 2026; arts and entertainment only $1.63. Within an industry, terms carrying model numbers, specs, or procurement intent like "supplier" and "manufacturer" generally cost more than broad category terms — and bring qualified inquiries more often.
Country and Region
Competition intensity, advertiser counts and purchasing power differ by country, so the same keyword has a different bid range everywhere. Reliable per-country CPC comparisons are hard to find publicly; the practical move is to check the same set of terms country by country in Keyword Planner.
Competition
In Google's own phrasing: the closer the advertiser below you is to your rank, the more you pay; the bigger the gap, the better your odds of winning, though the unit price can still be higher. Ad slots above the search results carry a higher threshold and usually cost more in actual CPC than lower positions.
Ad Quality and Landing Page
When calculating Ad Rank, Google looks at ad quality at auction time: expected click-through rate, ad relevance, and landing page experience. Quality Score is the 1-to-10 diagnostic built from those three — and Google is explicit that it does not enter the auction itself and should not be gamed as a KPI. Treat it as a health check: a low score means users find the ad and landing page off-target, and that shows up in cost through the auction-time quality assessment.
Bid Strategy
Under Manual CPC, your max bid is essentially the per-click ceiling; with automated bidding, actual cost per click can exceed the max CPC. Target CPA and Target ROAS aim at conversion cost and return, not click price, so average CPC rising after a switch to Smart Bidding is not necessarily bad news. Before switching, understand the learning period and budget guardrails first — and do not start adjusting daily the moment you switch.
Minimum Test Budget and Testing Timeline
Google has no minimum spend, but a too-small budget has a different problem: it cannot accumulate enough data in reasonable time to judge anything. Estimate the test budget like this:
Test budget = conversions needed during the test × estimated CPA × buffer factor
How many conversions you need depends on the question. To see "does this market produce inquiries at all", a dozen or so qualified conversions can show a signal; to move to Target CPA-style Smart Bidding, the bidding and budget guide covers the official calibration — a 30-day window referencing at least 30 conversions. The buffer factor covers the higher CPA typical early in a test; examples use 1.3 to 1.5.
With the B2B example: estimated form CPA $147, 20 forms wanted during the test, buffer 1.3 — test budget ≈ 20 × 147 × 1.3 ≈ $3,800.
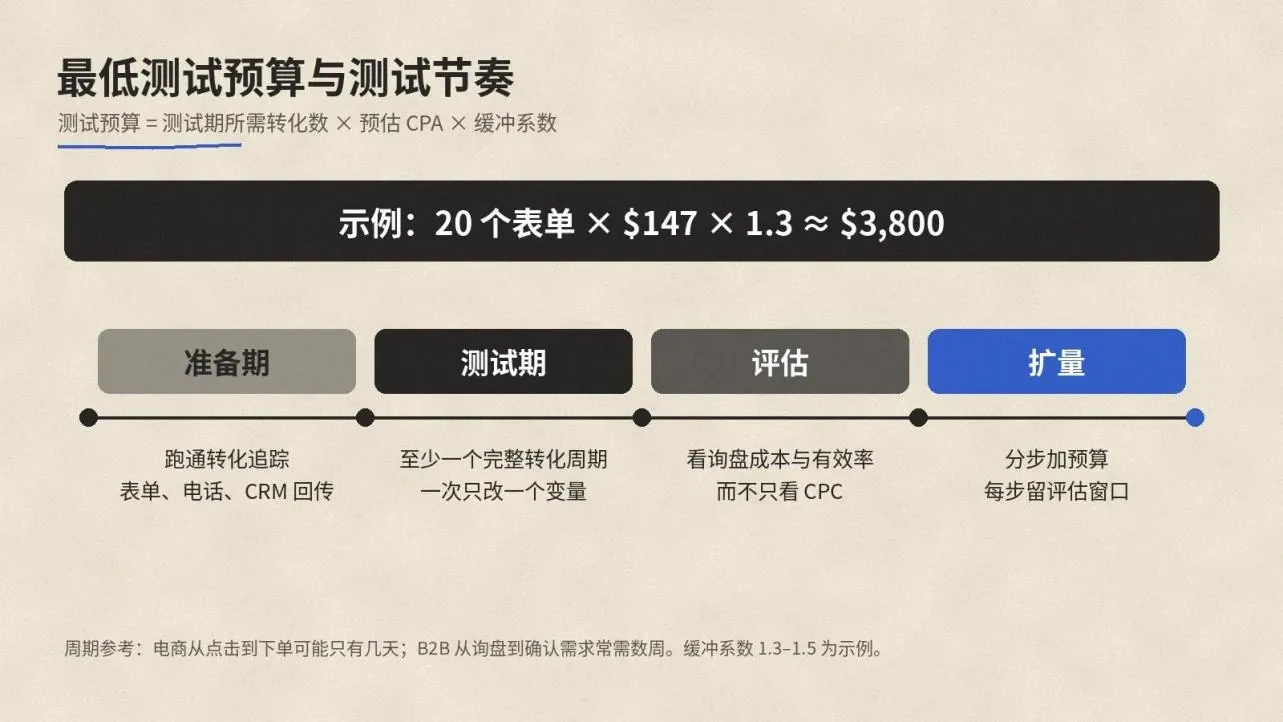
Run the test for at least one full conversion cycle. Ecommerce click-to-order may take days; B2B inquiry-to-confirmed-need often takes weeks. Change one thing at a time during the test, or you will not know which move caused the change.
One prerequisite: conversion tracking must work before spending starts. Without dependable conversion data, the test budget burns without yielding a conclusion, so get conversion tracking and attribution in place first.
Choosing an Agency: Seven Checks Before You Sign
- Account ownership first. Admin rights on the ad account and the manager account stay with you; the agency is attached via the manager account. If the relationship ends, the account and its history stay yours.
- Then credentials. If they claim Google Partner status, look them up in the Google Partner directory — company name, website, region and certified product areas are all listed.
- Spend transparency. You can log in anytime to see real spend; top-ups and remaining balance reconcile.
- Do they do tracking before campaigns? Solid teams sort out conversion actions, forms, calls and CRM feedback before building campaigns.
- Reporting scope. Do reports go beyond impressions, clicks and CPC to inquiry cost, qualified-inquiry rate, and closed-deal feedback?
- Decision rights and exit terms in writing. Who proposes and who approves budget increases, bid-strategy changes, new markets. Contract length, early-termination conditions, and what happens to unused balance.
- Check the work plan against the full Google Ads optimization framework — account structure, bidding, creative, landing pages: are they all covered?
Common Pitfalls
- Comparing CPC alone. Cheap clicks that do not convert waste more than expensive ones that do; judge budgets by cost per inquiry and cost per deal.
- Setting budgets from industry averages. Sample markets, account types and conversion definitions differ from yours; use them for magnitude only.
- Spreading a small budget thin. A few hundred dollars a month across five countries and ten ad groups accumulates data nowhere; with limited money, concentrate on one market and the terms nearest purchase.
- Testing too briefly or changing too often. Switch direction after a week without inquiries, or change bids, budgets and keywords at once, and the test concludes nothing.
- Raising budget before tracking works. Neither people nor algorithms can tell which spend is worthwhile; scaling multiplies uncertainty.
- Choosing a provider for "signup bonuses" or "spend rebates". Put the perks into full-year total cost, and check for attached conditions like minimum spend or account ownership.
Final Thoughts
How much Google Ads costs is not answered on a quote sheet; it is answered in your gross profit, close rate and conversion rate. Work out the affordable cost per inquiry or order, run a feasibility check against real keyword prices, then add service fees and hidden costs — a budget built that way stands up to questioning.
If you are setting a first Google Ads budget for a new market, or want to know whether an existing account's spend is being used well, String Global's Google Ads team starts by unpacking your business metrics and affordable costs with you before proposing any media plan.
Related Reading
- The Google Ads Optimization Overview, the full framework from market judgment to diagnostics, with this piece expanding the budget and cost layer.
- High Search Volume Does Not Mean a Market Is Worth Entering, the market-opportunity check that comes before budgeting, used alongside this article's calculation flow.
- Google Ads Bidding and Budget: From Manual Control to Smart Bidding, bid strategies, learning periods and scaling guardrails — how the budget gets spent.
- Google Ads Account Setup and Structure, the operational checklist for registration, verification and account hierarchy.